Fields output is configured on Scale bar:
|
|
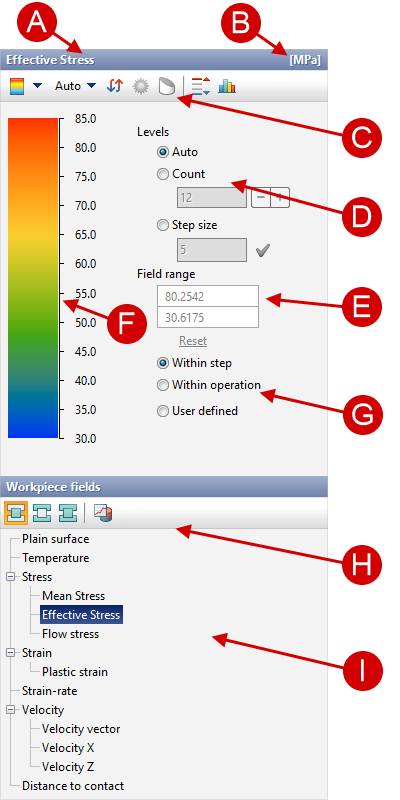
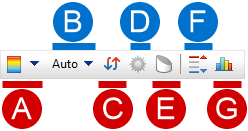
Setting the display of the scale for the current fields is carried out using the Scale control panel:
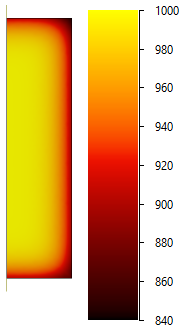
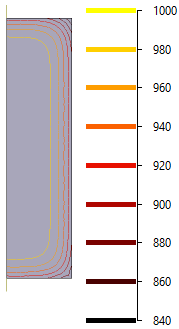
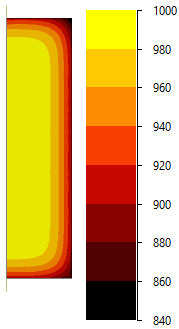
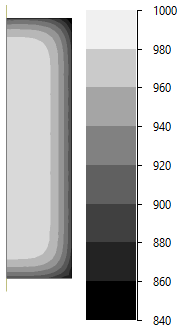
Filling the scale can be of three types: gradient, discrete and isolines (there is a case with symbols). Each fill can be displayed in grey, which is useful for non-color print:
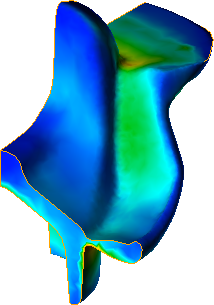
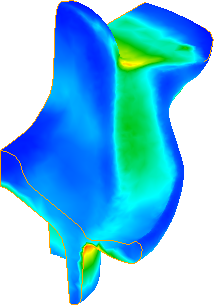
When shadows are enabled, the fields is displayed taking into account the current illumination of the object. In this case, the color of the displayed fields look darker than the colors of the scale:
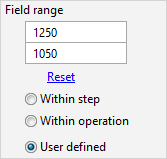
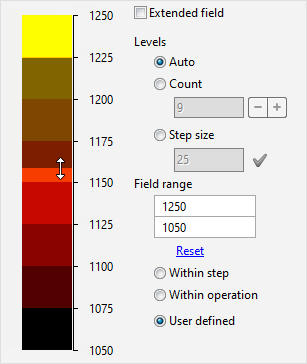
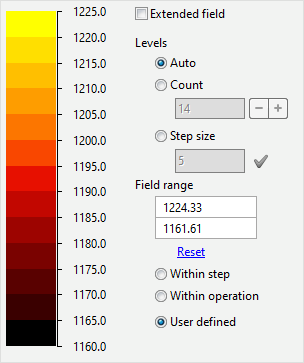
To control the color scheme, the minimum and maximum value of the selected fields can be specified in Scale range options:
You can also change the scale range with help of the mouse cursor. To do this, move the cursor to the scale and holding the left mouse button move the cursor up or down and release the button:
In order for the maximum and minimum value of the scale to be set based on the simulation results, it is necessary to select Within step or Within operation in scale range options. Slider Vector fields scale is available when the workpiece or tool vector field is active. With it, you can proportionally change the length of the displayed velocity vectors:
|


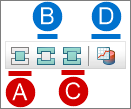
The availability of a fields for output depends on the following criteria: 1.Object type (workpiece, tool); 2.Operation type (general forming, cooling/heating); 3.Activation of the simulation of additional cases (with thermal process, thermo-elasto-plastic problem, quenching, tempering); 4.Activation of the simulation of additional fields (relative Density, wear, subroutines). The objects type is selected on panel for selecting the type of objects for displaying fields:
Workpiece fields:
Tool fields:
General fields:
Fields in tracing points: This feature allows you to show the current value of the selected fields in traced points. When this feature is activated, the tracing points take on a color according to the color scheme of the scale and the value of the selected fields in each traced point.
Show graph of a function along a line: This feature brings up a special window Graphs, which allows you to analyze the change in the values of the selected fields along the line. The principle of work in this window is similar to the principle of work in the window Measurements and general window Graphs. First, at the bottom of the window, you have to select one of the construction modes - Line segment, Line on surface or Line on edge. Similar to the measurements window, each point is assigned by double-clicking the mouse or manual by clicking on the drop-down list icon, entering coordinates and clicking OK.
After setting the points in the window Show graph of a function along a line their coordinates, distance between points and graph are displayed . The Graph is built as a piecewise linear function built on the points lying on the line and the values at these points. The amount of points along the line can be controlled by changing the parameter Amount of points. With the selected mode Line segment a straight line is drawn between two selected points. In this case, the resulting line may not belong to the selected body in some intervals. The Graph for such a line will be discontinuous.
In mode Line on surface after specifying two points QForm UK will create a curve along the plain surface of the selected body. The construction of the curve is performed by projection. For this mode, it is possible to select a third point by activating the feature Middle point. This point defines the plane position on which the projection will be performed.
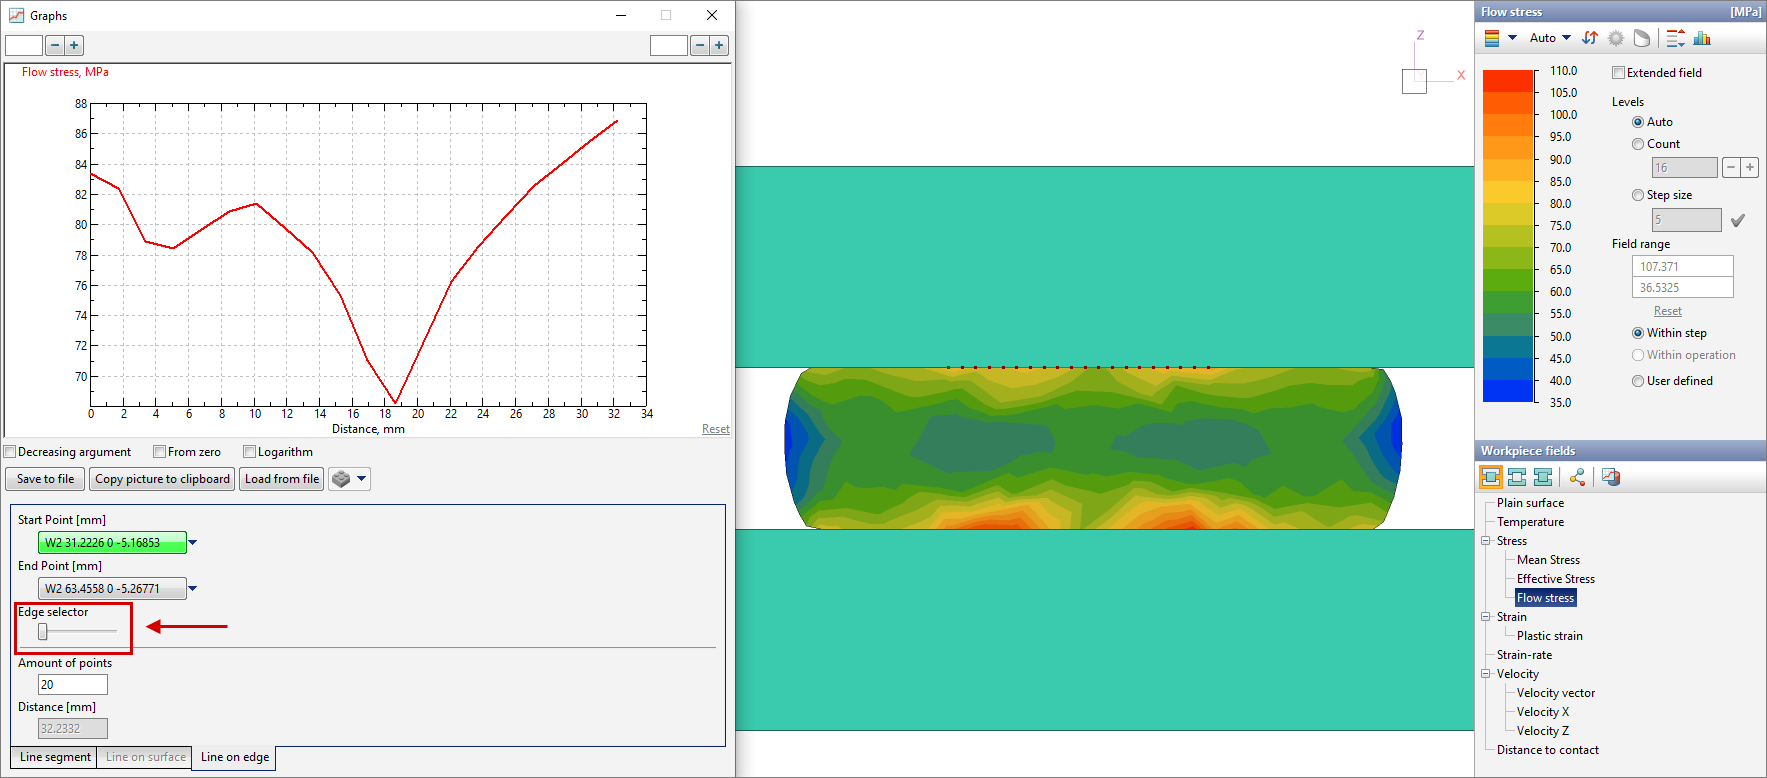
In mode Line on edge when specifying points near edges QForm UK determines the point lying on the nearest edge. After specifying two points, a curve will be drawn along the edge of the selected body.
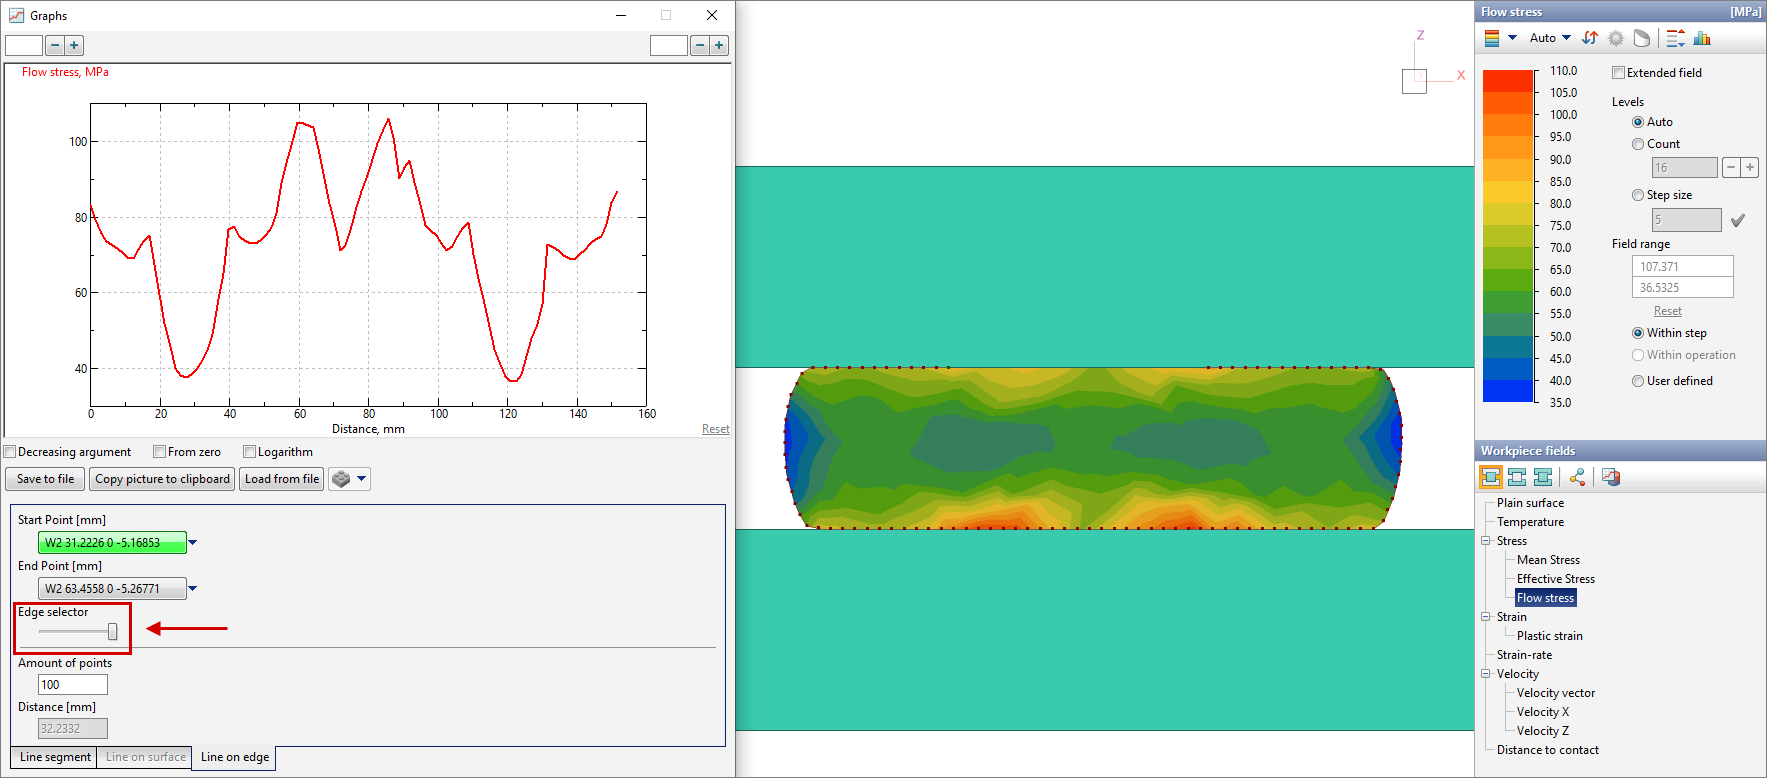
If the edge is closed, after specifying two points, you can select the direction of the contour along which the curve will be built by changing the position of the slider.
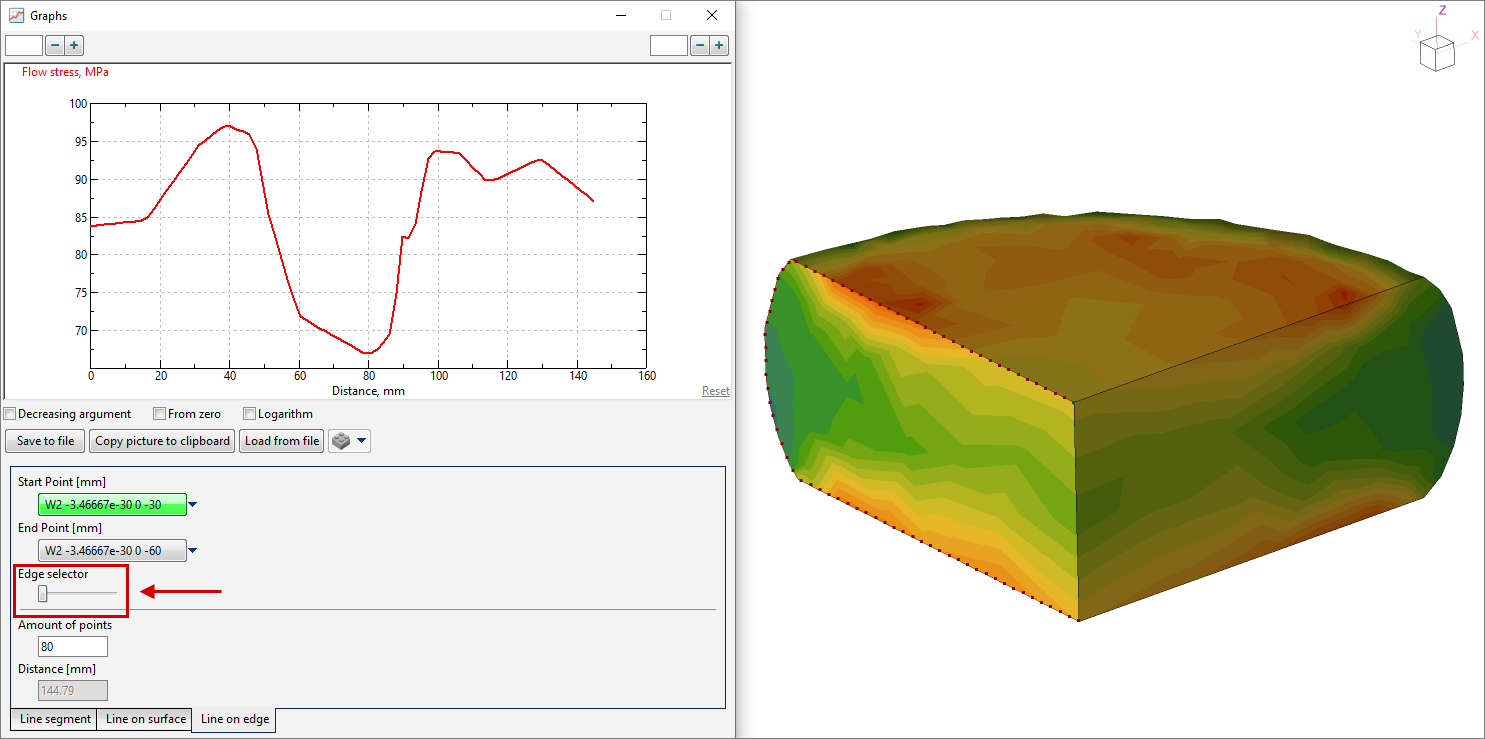
Also, if you specify the start and end points in the same place, the curve will be built along the entire selected contour. In this case, the slider controls the direction of the contour traversal. If the start and end points are specified at nodes that belong to two or more edges, by changing the position of the slider, you can select the edge along which the curve will be built.
Other possibilities of the window: change of division value; the ability to show, hide or smooth out the selected curve; Decreasing the argument; Taking into account the zero of the function; displaying a graph for a user defined interval on the x- axes and resetting the interval; Save to file; Copy picture to clipboard; Load from file - work similar to a general window Graphs. In addition, if the window Graphs is open, it is possible to add a graph when Creating animations and images. Window Graphs size will match the size of the graph in the animation or image. |
|||||||||||||||||||||||||||||||||||||||||||||||||||||||||||||||||||||||||||||||||||||||||||||||||||||||||||||||||||||||||||||||||||||


See also: