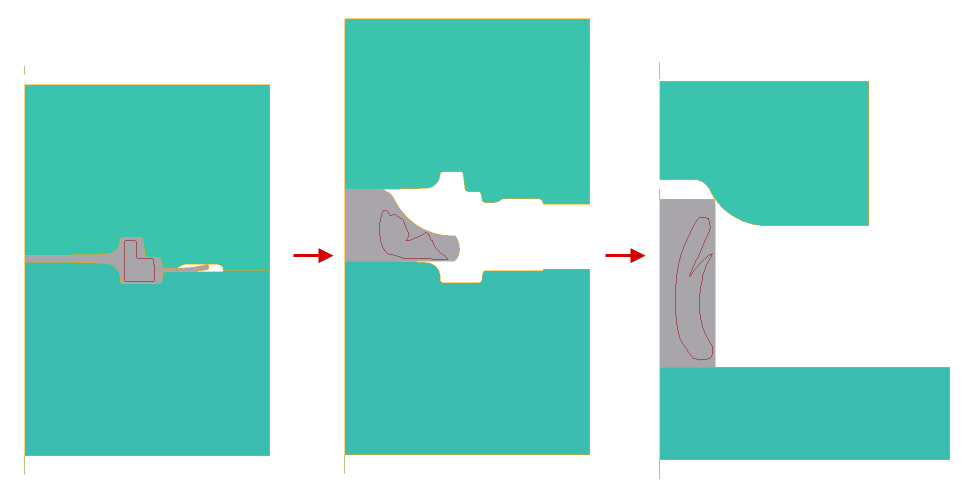
Work with tracing objects is carried out in the tab Tracking points, lines. Tracing is possible from any step.
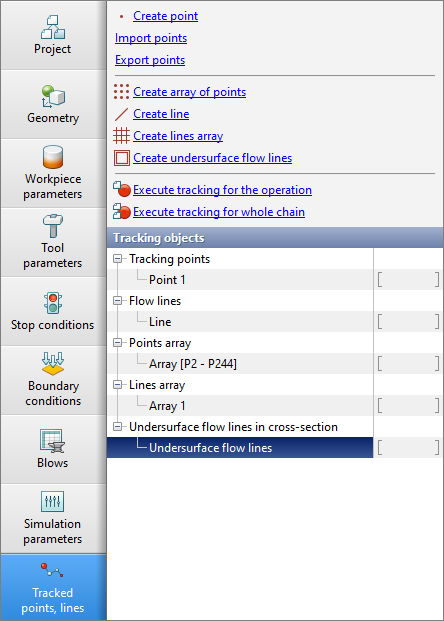
On the panel Tracking points, lines tracking objects are specified. For the selected object in the panel Properties its parameters, display options and a link for graphs (for tracking points) are displayed.
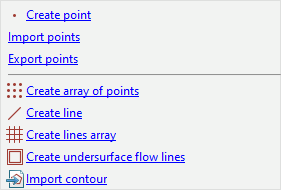
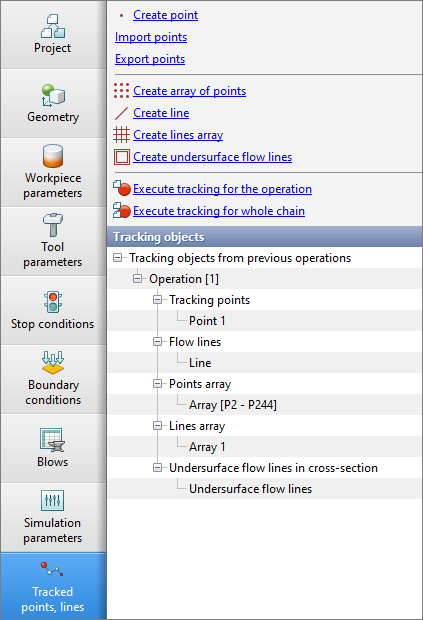
The selecting objects for tracing are carried out on the panel Tracking points, lines with help of the corresponding buttons
Specifying a traced point
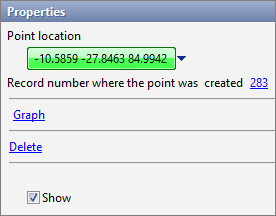
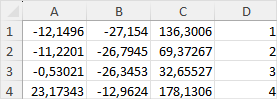
To set a traced point, double-click at any point of theWorkpiece. The traced point can be on the surface of the workpiece, in plane of symmetry, or inside the workpiece. For the last case you need to use the tool Create section plane. On the panel Properties the initial coordinates of the traced point and the simulation step at which this point was installed are displayed. After the trace, a link to graph is also displayed. You can create tracking points using coordinates from *.csv-, *.xls- or *.xlsx- file. Column sequence: coordinate X, coordinate Y, coordinate Z, ID. To load the file you need to click the button Import points. In a table with the same data set, you can Export points according to the simulation results.
Setting the array of tracking points
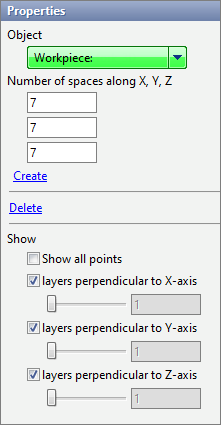
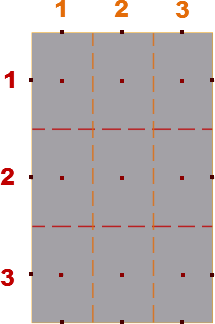
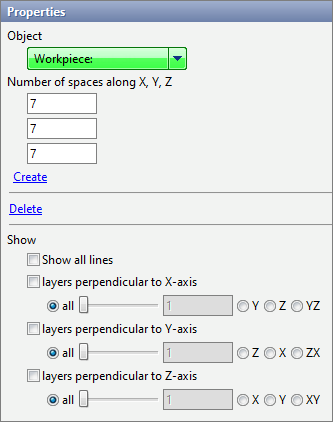
To specify the array of tracking points, you have to select a workpiece in the field Object, or double-click on the required workpiece. Next, should be set the number of intervals along each axes (for 3D tasks) or along the OX and OZ axes (for 2D tasks) and click Create. The principle of creating a domain of tracking points with a number of intervals of 3x3 is given below
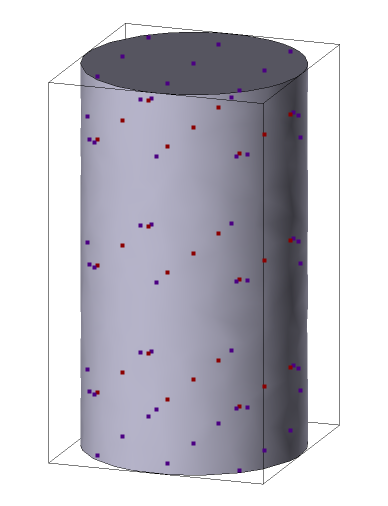
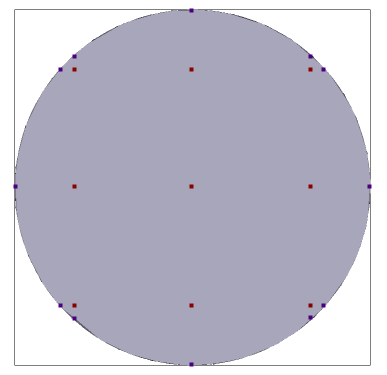
An example of a 3D object with a created array of points is given below.
The Workpiece is divided into a given intervals count along each axes and point are placed in the center of the resulting rectangles (for 2D tasks) or rectangular parallelepipeds (for 3D tasks). tracking points are also placed on the surface of the workpieces. In the section Show you can hide/ display certain points. When you hover the mouse cursor over a traced point, its number is displayed under simulation control panel
Setting the traced line
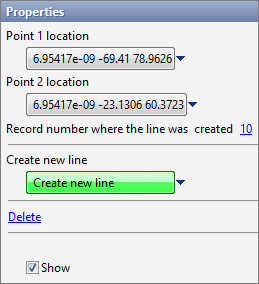
To define a traced line, you need to double-click at two different points of Workpiece. The traced line can be located on the surface of the workpieces, in plane of symmetry , or inside the workpieces. For the last case you need to use the tool Create section plane. On the panel Properties display the initial coordinates of the two points defining the traced line, and the simulation step at which this line was specified. Setting the traced lines array
To specify the domain of flow lines, you must select a workpiece in the field Object, or double-click on the required workpiece. Next, should be set the number of intervals along each axes (for 3D problems) or along the OX and OZ axes (for 2D problems) and click Create. The principle of creating a domain of flow lines is similar to the principle of creating tracking points. In the section Show You can hide/ display certain line (layers of lines). Setting up traced undersurface flow lines
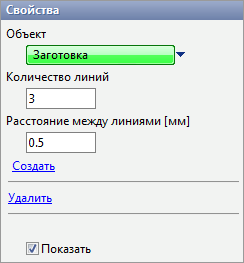
To define traced undersurface flow lines, you have to select a workpiece in the field An Object, or double-click on the required workpiece. Next, should be set the number of undersurface flow lines, the distance between them and click Create. For 3D tasks before choosing Create undersurface flow lines Setting the contour Contour tracing is only available for 2D tasks. At the required step you need to go to the tab Tracking points, lines and press Import contour. The software will prompt you to download *.dxf file with one or more contours.
|
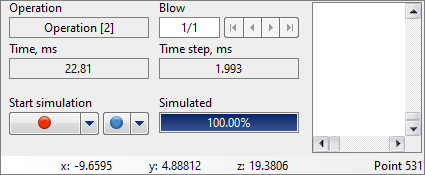
After specifying the tracking objects at a certain simulation step, it is necessary to calculate (trace) their position at other simulation steps. This can be done help one of the two buttons located on the panel Tracking points
Flow lines and point are auto transferred to the next and previous operation (blows). In the tab Tracking points, lines all transferred tracking objects will be displayed:
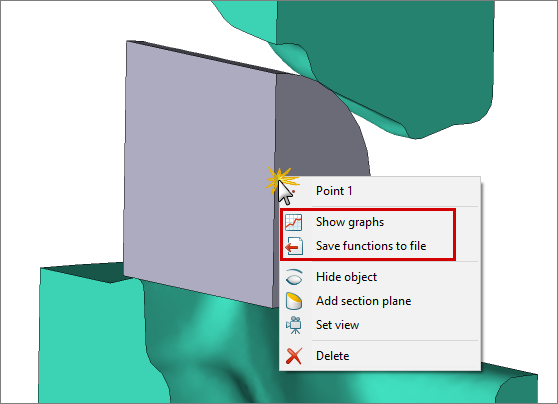
tracking objects can be Delete only during the operation (blow) during which they were created. If you right-click on a specific traced point, you can plot graph selected function for this point or save all function calculated at this point in *.csv-, *.xls- or *.xlsx- file:
|
See also: