In QForm UK the interface and the simulation core are completely separated and work independently, so it is possible to view all simulation results both during the simulation and after it is stopped. The program has a wide range of tools for managing the objects displaying, the calculated fields output, graphs and tracking information:
|
Tools for analyzing simulation results |

Below is an overview of the available options for analyzing simulation results:
Control for displaying of objects is carried out with the help of the buttons on the Toolbar***:
The information about the finite element meshes of objects is carried out by the button Mesh properties
See also: |

The tools to control the output of the fields are located on the right side of the main program window. The simulated fields are divided into four groups: workpiece fields, tool fields, common fields and fields at tracking points:
By means of Scale panel the display parameters of the fields and the scale range can be changed:
See also: |


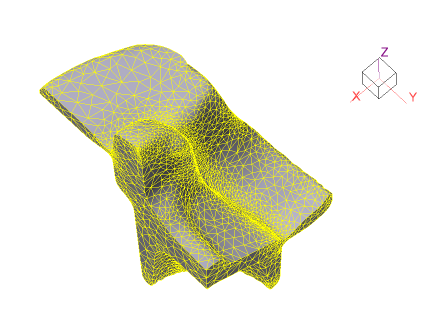
The section plane is added with the button Add section plane
The objects measurements window is opened with the button Measure
See also: |


The window for displaying graphs is opened with the button Graphs It is possible to display graphs of energy-power and kinematic characteristics of tools, workpieces volume, some simulation parameters, as well as calculated values at tracking points:
Export of data from graphs is carried out in files with extensions *.xlsx, *.xls, *.csv See also: |


To saving images and animations with simulation results , click the button
In the window that opens, you must specify the directory for saving graphic files and other settings for images or animation. Images are saved as files with the extension *.png, animation - to files with the extension *.wmv See also: |

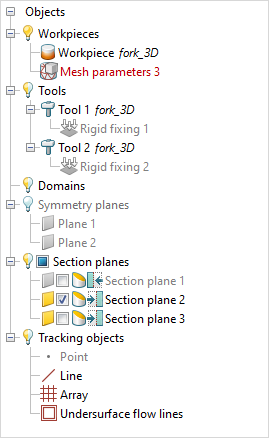
help Object tree, located in the upper left angle of the results view window , you can quickly set display parameters for all types of objects. If you right click on an element Object tree, advanced commands will appear, with which you can delete or copy a tree element , switch to positioning mode, set an alternative name for the object:
See also: |
Tab Source data panels Simulation state is used to display the values of the simulation parameters, power and kinematic tools parameters, workpieces volume , as well as the simulation duration for the current simulation step:
When you click on a workpiece or tool with the right mouse button in the list of commands , the command is available Field value at point
With the commands Show graph of a function along a line
You can view detailed statistical info about calculated fields:
See also: |


The multi-window mode for viewing simulation results allows you to divide the applications window into several windows (from one to four), in each of which the same simulated operation or different operation from one or different projects can be opened (*.qform-files). It is possible to synchronize the display options of objects and calculation fields in different windows, link the position and linear scale of objects in different windows:
To make it easier to analyse the results, you can enlarge the viewing area of the simulation results by hiding the bottom (Ctrl + B) and left (Ctrl + L) panels. You can also hide panels and select the number of windows inMain Menu > View.
See also: |

