This section provides a brief overview of the tools for analyzing simulation results in QForm UK. Consider the simulation results of the example Fork.
Select Tool 1 and hide it with the button Hide object![]() on Toolbar or with the icon Object tree.
on Toolbar or with the icon Object tree.
Hide tracking objects with an icon Object tree.
Select Temperature on the panel Workpiece fields. The temperature scale will appear on the scale panel, and in the boxes Field range the maximum and minimum temperature value for the selected simulation step are displayed. Point with maximum and minimum temperature can be show on the workpiece by clicking on the icon ![]() on Scale bar:
on Scale bar:

On panel FieldWorkpiece fields on the list Strain click Plastic Strain. The plastic strain distribution scale appears on the scale bar.
Choose an feature Scale range - User defined and enter the maximum (10) and minimum (0,5) scale value. Choose a scale palette Legacy:

Hide Workpiece by click the icon Object tree, select in the displayed fields panel Toolfields and press Temperature. Select the scale palette Auto.By default, the specified has Simple heat transfer to workpiece, in this case solve the simplified thermal task between the workpiece and tool, and the tool temperature is calculated only on the surface in contact with the workpiece:

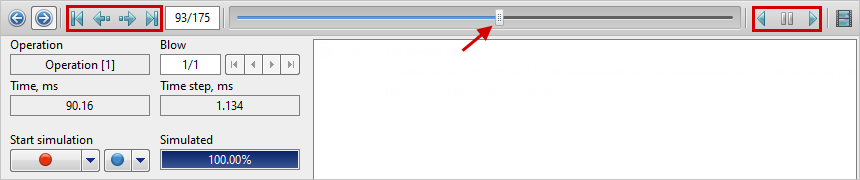
Using slider and buttons Playback bar, you can select the needed simulation record, as well as play the simulation animation:
Click the icon Graphs![]() on Toolbar, and a window will appear on screen Graphs. Click Add graph to the left and graph the function Load (Time) for object Tool 1by selecting the appropriate parameters in the window that appears. After that click Add graph to the right and graph the function Velocity Z (Time):
on Toolbar, and a window will appear on screen Graphs. Click Add graph to the left and graph the function Load (Time) for object Tool 1by selecting the appropriate parameters in the window that appears. After that click Add graph to the right and graph the function Velocity Z (Time):
|
|


Both graph will be displayed on screen at the same time. If necessary, the selected graph can be hide or remove. Right-click on the graph name and select the appropriate command:

To show contact areas on the workpiece hide both tool and click on the icon Show/hide contact areas![]() on Toolbar:
on Toolbar:

To show contact nodes on the workpiece, deactivate the display of contact areas![]() and click on the icon Show/hide contact nodes
and click on the icon Show/hide contact nodes![]() on Toolbar:
on Toolbar:

Display a graph of the workpiece temperature changes along a given line in the cross cut plane of the workpiece.
Activate the view XOZby click on the view cube, and create a section plane by click on the icon Addsectionplane, move the section plane with the positioning grip, then close positioning mode:

Hide the section plane and make the slice plane active:

Activate the workpiece temperature field, click on the icon Show graph along line![]() and specify the start and end point of the line in the created slice plane. Graph of active field values along the created line will display on screen.:
and specify the start and end point of the line in the created slice plane. Graph of active field values along the created line will display on screen.:

Show the tracking points by the object tree icons, right-click on one of the points:

Display a graph of temperature at the selected point:

Display field gartfield calculated subroutine Surface flow analysis, by select the appropriate function in the list of workpiece fields. Since this is a surface function, the calculated field will only appear on the surface of the workpiece.
See also: