The QForm UK have a lot of tools for analyzing the results. In this chapter, we will review the main tools used to analyze the results in ring rolling processes.
The main distinguishing feature of the Ring rolling module is the additional graphs in the Process quality section.
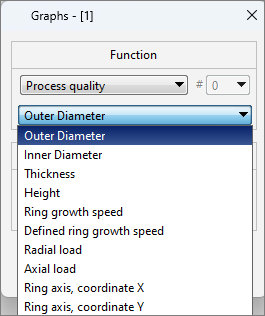
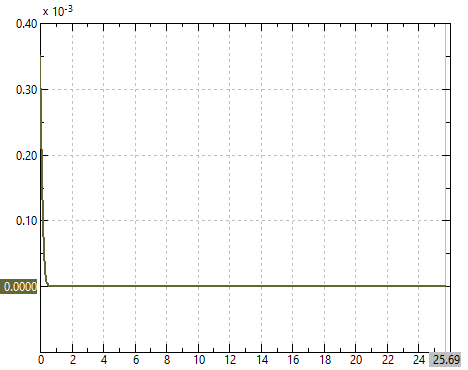
The graphs Outer Diameter, Inner Diameter, Thickness and Height allow us to visualize changing of these parameters during process.
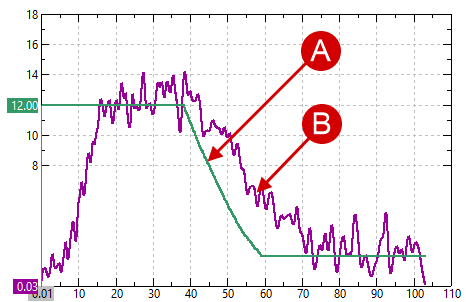
The graph Ring growth speed allows us to track the ring diameter increment per unit time according to the simulation. It is possible to display the ring growth speed and Defined ring growth speed on one graph and evaluate the deviations.
|
A - the defined ring growth speed ; B - the actual ring growth speed. |
Radial load - the load during the reduction in the radial direction (between the mandrel and the main roll).
Axial load - the load during the reduction in the axial direction (between the axial rolls).
The last two types of graphs - the ring axis, coordinate X and the ring axis, coordinate Y allow us to track the axis position of the workpiece. When activating the parameter Ring center stabilization along the Y axis in the tab Process parameters the coordinate Y for the ring axis will be a constant value and will be displayed as horizontal line.