|
Information |
To use the module Phase transformation the corresponding license feature must be active |
|
QForm UK allows you to enter the chemical composition of the alloy and use HT adviser for steels to form a material model for simulation of carbon and low-alloy steels heat treatment. In HT adviser for steels the calculation of properties takes place using different models within described application boundaries. This allows to check applicability. Different models can be used for the same chemical composition of the alloy.
Using different models in HT adviser for steels allows to obtain different kinetics of phase transformations. To assess the adequacy of the proposed model, it is recommended to use all possible data on the material provided by the manufacturer or supplier. A warning will be issued if the chemical composition is outside the use limits of a particular grade.
HT adviser for steels is based solely on models published in the technical literature. Properties generated by HT adviser for steels are used as a first approximation and most likely should be corrected based on experimental data. The sources used are listed below.
To use the assistant you need:
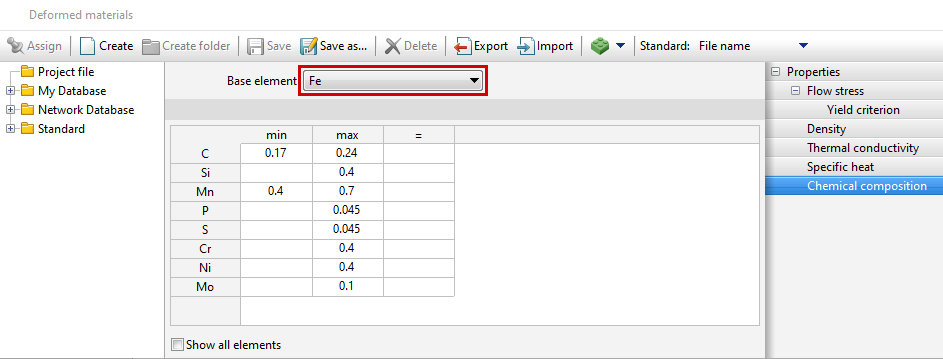
1.Set the chemical composition of the steel. Iron must be chosen as the base element.
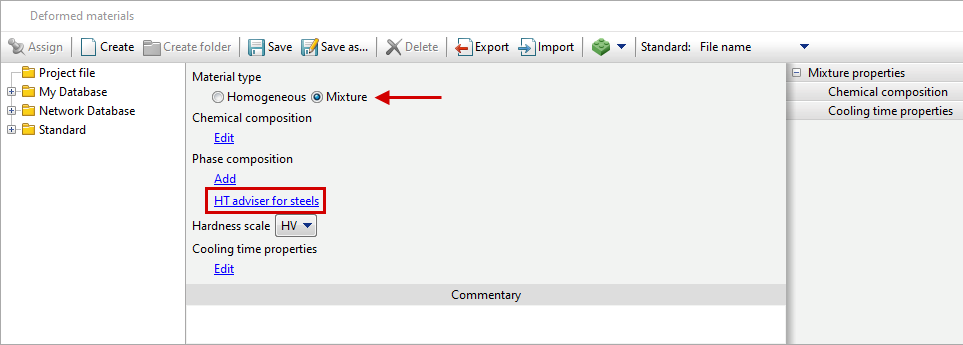
2.With the Material type switch in the position Homogeneous, the standard set of material properties must be filled in. Then, they will be auto copied into all phases of the newly created multiphase material.
3.Set the Material type switch to Mixture and in the Phase Composition section click on the HT adviser for steels button.
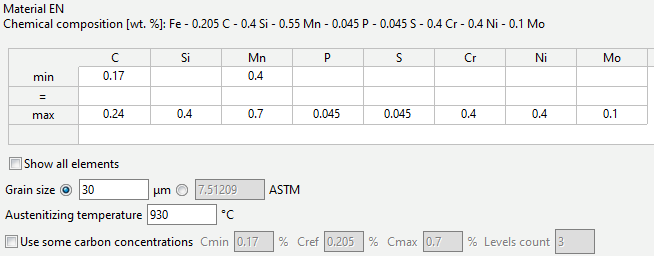
4.In the adviser window, set the initial austenitic grain size (in ASTM points or micrometers) and austenitizing temperature.
|
Information |
If necessary, it is possible to edit the chemical composition. |
|
To simulate the diffusion processes, you need to activate Use some carbon concentrations.
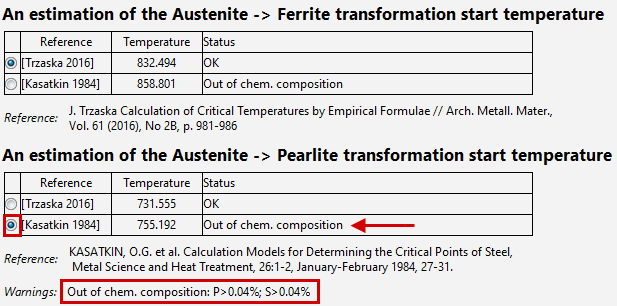
5.Select model to determine the temperatures of the beginning of phase transformation:
•Austenite -> Ferrite
•Austenite -> Pearlite
•Austenite -> Bainite
•Austenite -> Martensite
|
Information |
By default, HT adviser for steels automatically selects grades with a status of OK for the specified chemical composition. |
|
|
Important |
Please note possible limitations on the applicability of the models. Restrictions that are not being met are displayed in theWarnings section |
|
6.Select a model for constructing TTT diagrams. The predicted TTT curves for different phase transformations are shown in different colors on the graph. The correspondence between colours and curves is explained below the graph.
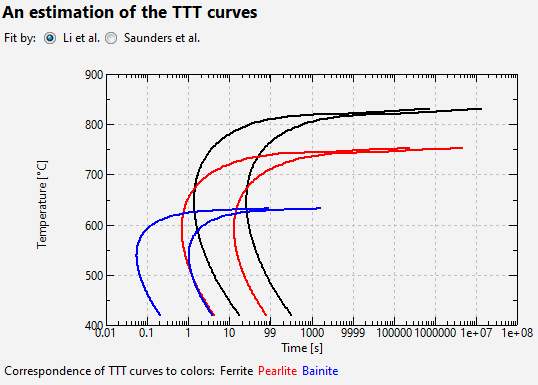
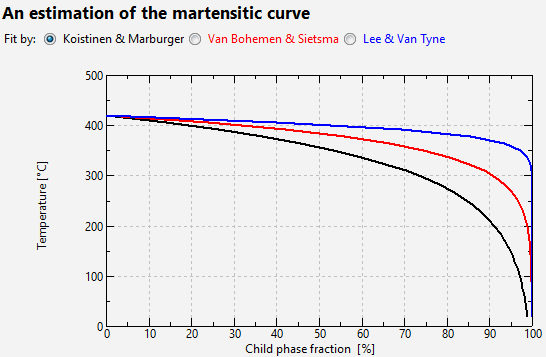
7.Select a martensitic transformation model.
|
Information |
The proposed curves are shown in different colors. The color of the curve corresponds to the color of the model name. |
|
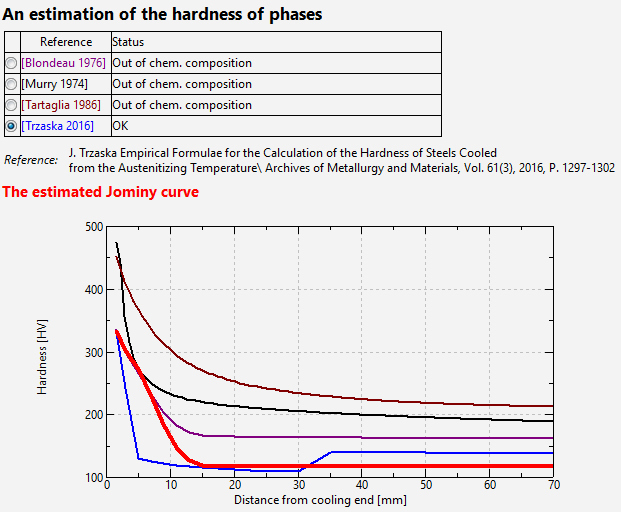
8.Select a model for assessing the hardness of individual phases
|
Information |
Column model name Color Reference corresponds to the color of the hardenability curve predicted by this model. The hardnesses of the individual phases listed in the table are obtained by selection in such a way that the hardenability curve (thick red line) obtained by modelling in QForm UK is as close as possible to the hardenability curve predicted by the selected model. Since the selection process is based on the use of an evolutionary optimization method, it is not the only possible one. That is, if you switch between different models in the table, then, when you turn on the same model again, it is possible to obtain different sets of hardnesses for the phases. |
|
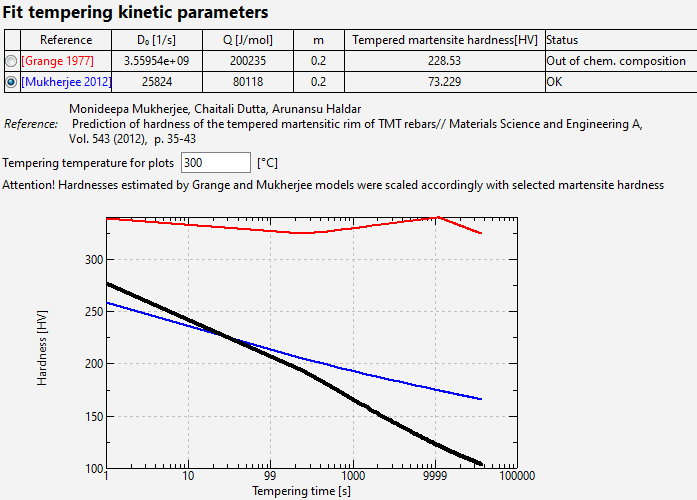
9.Select a model for assessing martensite tempering.
|
Information |
The graphs show the change in martensite hardness over time process tempering at a given temperature. The graph for the model [Grange 1977] is shown as a thin red line, for the model [Mukherjee 2012] – as a thin blue line. Graph actual after selecting the tempering kinetics parameters (D0, Q and m), which will be obtained as a result of simulation inQForm UK – thick black line Since Grange and Mukherjee used their own ratio for the hardness of martensite, in order to be consistent with the already selected hardnesses of the individual phases (take a look at table above), the graphs for the Grange and Mukherjee models are adjusted by multiplying by a amplification factor for shear modification (take a look at warning above the graph) |
|
10. Click the button OK
As a result of the adviser’s work, the following multiphase material will appear with the filled-in parameters of the kinetics of phase transformations and the operational properties (hardness and tensile strength) of the phases.
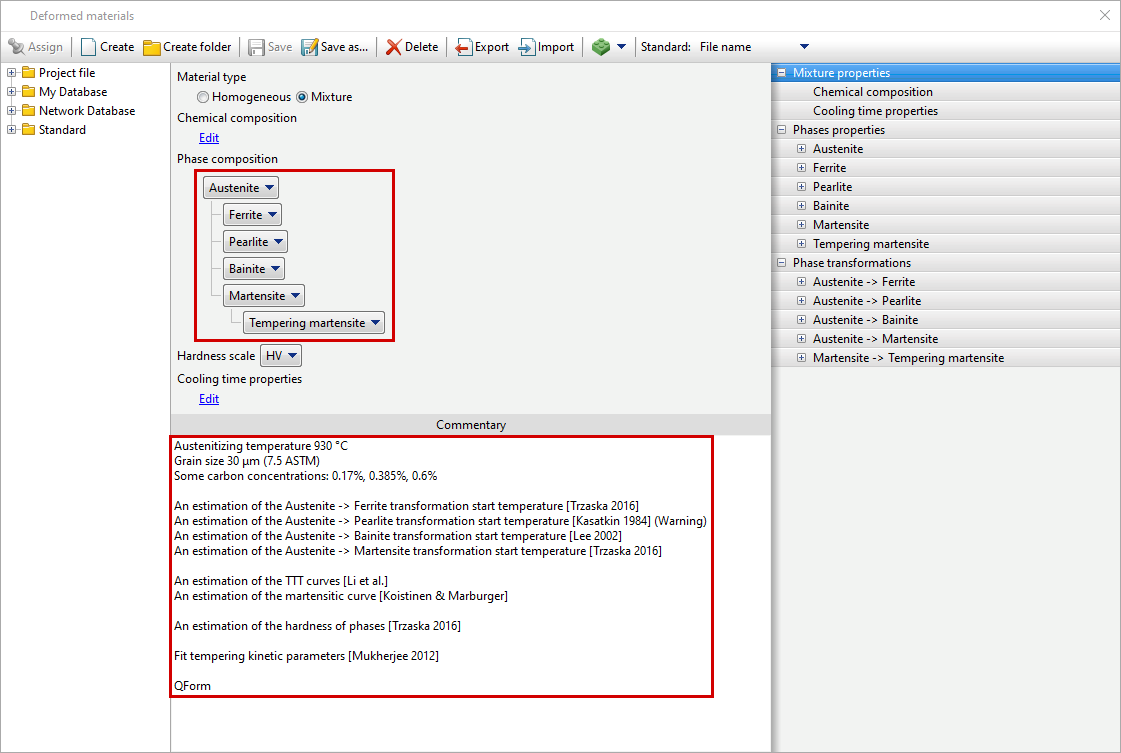
Other phases properties will be filled in by copying the properties of the single-phase material. All models selected by the user in the assistant will be reflected in the material comments, including concentrations used or exceeding the limits for the selected estimate. The last line indicates the software version in which the material was generated.
HT adviser for steels is intended for preliminary analysis. We recommend refining the resulting models based on experiments performed in production.
|
Important |
The HT adviser for steels is constantly being improved. Material models created in earlier versions may differ. |
|
After checking and confirming the material model, you should not generate material properties every time you update QForm UK.
1.G. Murry methode quantitative d'Appreciation de la trempabilite des aciers. exemples d'application //Communication presentee aux 13emes Journees des Aciers Speciaux, a Saint-Etienne, 16-17 May 1974 2.Blondeau, R.et al.: Mathematical Model for the Calculation of Mechanical Properties of Low - Alloy Steel Products: A Few Examples of its Application. In: 16th International Heat Treatment Conference Heat Treating C76, The Metals Society Stratford-upon-Avon, 1976, P. 189-200 3.J. M. Tartaglia, G. T. Eldis, andJ. J. Geissler Hyperbolic Secant Method For Predicting Jominy Hardenability: An Example Using 0.2C-Ni-Cr-Mo Steels // J. Heat Treating, Vol. 4(4), 1986, pp. 352-364 4.J. Trzaska Calculation of Critical Temperatures by Empirical Formulae // Arch. Metall. Mater., Vol. 61 (2016), No. 2B, p. 981-986 5.J. Trzaska Empirical Formulae for the Calculation of the Hardness of Steels Cooled from the Austenitizing Temperature\\ Archives of Metallurgy and Materials, Vol. 61(3), 2016, pp. 1297-1302 6.T. Kunitake, Y. Okada The Estimation of Bainite Transformation Temperatures in Steels by Empirical Formulas. Tetsu-to-Hagane, 84: 2, February 1998, 137-141. 7.YK Lee et al. Empirical Formula of Isothermal Bainite Start Temperature of Steels. Journal of Materials Science Letters, 21:16, 2002, 1253-122. 8.C. Capdevila et al. Determination of Ms Temperature in Steels: A Bayesian Neural Network Model ISIJ International, 42: 8, August 2002, 894-902. 9.SMC VAN BOHEMEN and J. SIETSMA Martensite Formation in Partially and Fully Austenitic Plain Carbon Steels // METALLURGICAL AND MATERIALS TRANSACTIONS A, Vol. 40A. 2009. P. 1059-1068. 10.KASATKIN, OG et al. Calculation Models for Determining the Critical Points of Steel, Metal Science and Heat Treatment, 26: 1- 2, January-February 1984, 27-31. 11.R.A. Grange, CR Hribal, L.F. Porter Hardness of tempered martensite in carbon and low-alloy steels // Metallurgical transactions A, Vol. 8A (1977), p. 1775-1785 12.Monideepa Mukherjee, Chaitali Dutta, Arunansu Haldar Prediction of hardness of the tempered martensitic rim of TMT rebars // Materials Science and Engineering A, Vol. 543 (2012), p. 35-43 |